
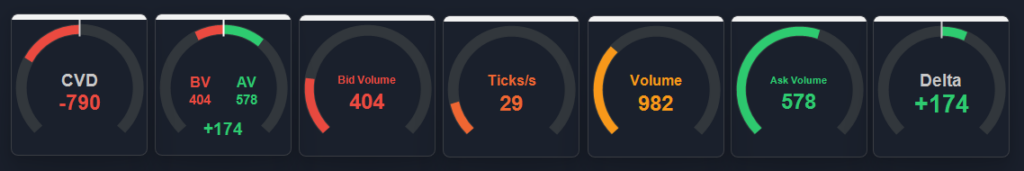
Flow Gauges for Sierra Chart
Floating arc gauges that turn volume, delta, CVD, and tape speed into a single visual read. Each gauge runs as its own study, floats over any Chart or DOM, embeds/floats with a double-click, and is freely resizable.
Note: The same gauges will be available with configurable data source inputs in a separate bundle.
No credit card required.
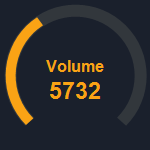
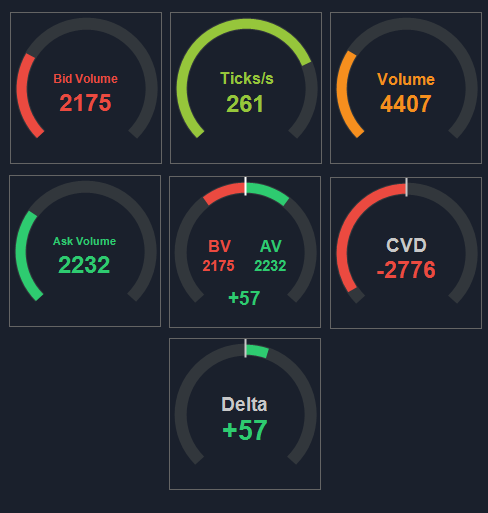
Volume Flow
Total volume per bar on a single gauge. Same data as Sierra Chart’s built-in Volume study. Auto-color gradient shifts from low to high as the gauge fills.
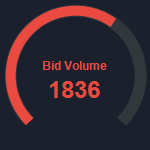
Bid Volume Flow
Bid-side volume on its own gauge. Same data as Sierra Chart’s built-in Bid Volume study. Pair with Ask Volume Flow for a side-by-side read.
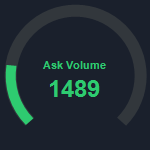
Ask Volume Flow
Ask-side volume on its own gauge. Same data as Sierra Chart’s built-in Ask Volume study. Pair with Bid Volume Flow for a side-by-side read.
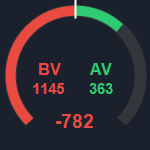
Bid vs Ask Volume Flow
Dual gauge with Bid Volume on one side and Ask Volume on the other. Optional gap value shows delta, total, or percentage.
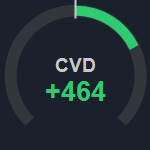
CVD Volume Flow
Cumulative delta on a bidirectional gauge. Same calculation as Sierra Chart’s built-in Cumulative Delta Bars – Volume study. Positive fills one direction, negative fills the other.
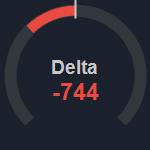
Delta Flow
Per-bar delta (ask minus bid) on a bidirectional gauge. No cumulative tracking, just the raw delta for each bar.
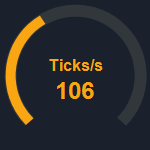
Tape Flow
Measures tape speed from raw Time and Sales data. Count trade prints or sum volume over a configurable rolling window.
Flow Gauges
Key Features
- Float or Embed – Each gauge runs in its own floating window. Double-click to embed directly on the Chart Region, Scale Region or DOM Column. Right-click for the context menu while floating.
- Resize – Drag the window edge to make a gauge larger or smaller. Text and arc thickness scale proportionally.
- Auto Range – The gauge max automatically ratchets up to the highest value seen during the session. The peak never decreases on its own. Right-click the Gauge submenu and select Reset Auto Range to recalibrate after a spike.
- Threshold Markers – Place a tick mark at a specific value on the arc. Bidirectional gauges mirror the threshold as +/- automatically.
- Auto Markers – Evenly spaced division marks across the arc for visual reference. Set 1 to 5 markers, or disable with 0. Markers adjust automatically with the current max value.
- Anti-Aliased Rendering – Floating mode uses smooth arc rendering. Embedded mode uses Sierra Chart’s native GDI, which may show minor arc artifacts at smaller sizes. Disable anti-aliasing on the Gauge tab to match rendering between modes.
- Auto Color Gradient – Unidirectional gauges can color the arc through a low, mid, and high gradient based on fill percentage. Bidirectional gauges use positive, negative, and zero colors.
- Subgraph Output – Every gauge outputs its current value as a subgraph, matching the output of Sierra Chart’s built-in study of the same name. Use it for spreadsheet logging, alert conditions, or as input to other studies. Tape Flow also outputs its peak value.
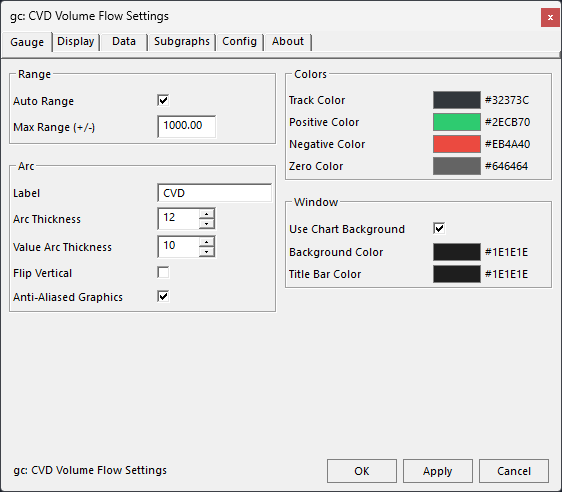
- Settings Window – All configuration is managed through a tabbed settings window with Gauge, Display, and Data tabs. Right-click the chart and select Open Settings, or use the context menu on the floating window.
- Presets – Save, load, and share named configuration presets. Each gauge type stores presets in its own file. Export a preset to share it and import to restore settings.
- Right-Click Quick Toggles – Toggle Auto Range, Flip Vertical, Auto Color, Show Label, Show Value, and more from the Gauge submenu without opening the settings window.
- Theme Support – The settings window supports dark and light themes to match your Sierra Chart color scheme.
The Gauges
Each gauge is a standalone study. Add any combination to a chart or DOM. All seven share the same floating window framework, settings window, and configuration options. The difference is what data they display and how the arc behaves.
Unidirectional gauges (Volume, Bid Volume, Ask Volume, Tape) show a single positive value. The arc fills from zero to the current value, with an optional gradient that shifts color as the gauge fills. These are best for tracking magnitude.
Bidirectional gauges (CVD, Delta) show positive and negative values. The arc fills in one direction for positive, the other for negative. Separate colors for each direction make it easy to read the sign at a glance. These are best for tracking net direction.
Dual gauges (Bid vs Ask) show two values on a single gauge, one arc on each side. The gap between the arcs can display delta, total, or percentage. This is the only gauge that shows two independent values simultaneously.
Setup
Each gauge is a separate study in the gcUserStudies_FlowGauges DLL. Add the ones you want from Analysis > Studies.
- Add a Gauge – Open Analysis > Studies, search for “gc:” and look for the Flow Gauge studies. Add one to your Chart or DOM.
- Position It – The gauge appears as a floating window. Drag it where you want it. Double-click to embed on the chart. Double-click again to float.
- Configure – Right-click the floating gauge and select Settings, or right-click the chart and select the study’s Open Settings menu item. All options are in the tabbed settings window.
Pricing
Flow Gauges - Free Access
Access is free. No credit card, no expiration, no catch. Click “Get Access” above to sign up.
If the studies have been useful, you can support the project here: [Contribute]
More questions? Contact support
Ready to try Flow Gauges?
No Credit Card Required, No Expiration.