Sierra Chart Momentum Tails

Momentum Tails for Sierra Chart (V2)

Momentum Tails is a Sierra Chart DOM study that displays where price has traded and the relative speed of movement. Color-coded tails appear on every price touch and fade over time, providing a visual record of momentum directly on the DOM. V2 adds a tabbed settings window, Big Print highlighting, a preset system, and theme support alongside the existing delta histogram, HUD meter, and volume overlays.

No Credit Card Required, No Expiration.

Looking for V1? See Momentum Tails V1

Key Features

  • Color-Coded Fading Tails – Every price touch lights up and gradually fades through up to 10 customizable color levels. Fast moves create long bright tails, slow moves create short faded ones.
  • Color Presets – Quick-start presets for white, dark, and light gray backgrounds, plus a Jigsaw-inspired palette. Custom color schemes can also be created manually.
  • Volume Display Modes – Volume numbers can be displayed on active tail rows only, across the entire visible range, or hidden completely. Last-traded rows use distinct styling to indicate the most recent print.
  • Split Column Mode – Both Bid and Ask can be assigned to the same DOM column (GP1/GP2/Label). The study automatically splits the column 50/50 with an optional separator line.
  • Combine Increment Aware – Auto-detects your DOM price scale on first load so tails, histogram bars, and volume text always align with the grid. Set to Auto or override manually.
  • Detection Modes – Two modes control when tails appear. Trade Volume Only creates tails strictly where trades occurred. Bid/Ask Movement triggers on Top-of-Book changes for broader coverage, which may include untouched price levels.
  • Intermediate Tails – Optionally fill in all price levels between trades to create a continuous trail effect. When disabled, tails only appear at exact trade prices, showing gaps where price skipped levels.
  • Big Print Highlighting – Threshold-based highlighting for large volume prints and delta imbalances at each price level. Three persistence modes: Decay Timer (fades after a timeout), Until Revisited (stays until a clearing condition fires), or Both (recommended, whichever fires first). Highlights clear automatically when SC volume is reset, and can be cleared manually from the right-click menu or with a modifier+click shortcut.
  • Disable Tails – Tails can be fully disabled, allowing the study to run Big Prints, histogram, delta, or HUD meter features without drawing any tails.
  • Volume Calculation Mode – Two modes control how volume is measured for highlighting and histogram calculations. All Recent Volume uses Sierra Chart’s raw recent volume. Tail Activity Only filters out volume that existed before the tail touched each price, so only fresh prints count toward thresholds.
  • Delta Histogram – Overlay histogram bars on tail edges showing delta or volume at each price level. Three modes are available (Delta, Delta Diagonal, Volume), with five color-intensity thresholds and variable bar width that scales by value.
  • Cumulative Delta Display – Displays cumulative delta across all active tails (Ask minus Bid Volume) directly on the DOM. Auto-positions above or below tails, or pin it to a fixed location.
  • HUD Meter – A visual gauge displays cumulative delta across active tails, with gradient or segmented fill, peak indicators that track min/max over a configurable window, and multiple presets from compact value-only to full gauge.
  • Settings Window – A tabbed config window replaces the native input list. Right-click on the Chart or DOM Region and select Open Settings, or use a modifier+click shortcut on the study column. Leave it open while tweaking and applying changes in real time.
  • Presets – Save, load, and export named configuration presets. Each study type stores presets in its own file. Share presets with others via import/export. Multiple DOMs can load from the same preset file for consistent setup.
  • Right-Click Quick Toggles – Open Settings, toggle the HUD Meter, Delta Display, and Histogram on or off, or clear all Big Print highlights from the right-click menu without opening Study Settings. Re-enabling restores your last-used mode.
  • Subgraph Output – Delta, Min Delta, and Max Delta are available as subgraphs for spreadsheet output, alerts, or referencing from other studies.
  • Theme Support – The config window supports dark and light themes with full color customization. Seven color controls allow matching the window to your chart appearance.

How It Works

Momentum Tails visualizes recent price activity directly on your DOM / Chart DOM. When price trades at a level, that row lights up in your brightest tail color. Over a configurable time interval, the color fades through each level (from hot to cool) until it disappears entirely.

The result is a visual heat trail. Areas of high activity stay bright longer, while isolated prints fade sooner. The display shows how far price swept, which levels had the most Volume, and where activity is concentrated or thinning.

On top of the tails, optional layers add depth: a histogram showing delta or volume magnitude at each price, a cumulative delta display summarizing the net direction of all active tails, and a HUD meter providing a visual gauge of that delta with peak tracking. Each layer works independently. One, some, or all can be enabled depending on the amount of information needed on screen.

V2 adds Big Print highlighting, which marks price levels where volume or delta imbalance exceeds a configurable threshold. Highlighted levels can fade on a timer, persist until a clearing condition fires, or use both. Highlights also clear automatically when SC volume is reset, and can be cleared manually from the right-click menu or with a configurable modifier+click shortcut.

A Volume Calculation Mode setting on the Volume tab controls how volume is measured for Big Print thresholds, delta imbalance, and histogram calculations. The default mode uses Sierra Chart’s raw recent volume. Tail Activity Only mode counts only volume that printed after the tail reached each price, filtering out stale volume that accumulated before the current move. This reduces false highlights at tail edges where old volume would otherwise inflate the numbers.
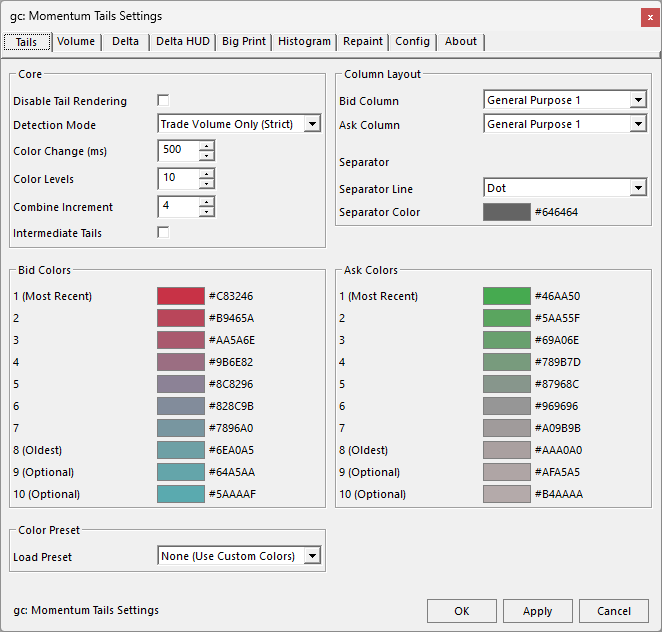
Settings Window

V2 replaces the native Study Settings input list with a tabbed config window. Each feature area has its own tab (Tails, Volume, Delta, Big Print, Meter, Histogram, DOM, Config, About), grouping related settings together. The window can stay open while you adjust and apply changes.

To open the settings window: right-click on the Chart or DOM Region and select Open Settings, use a configurable modifier+click shortcut on the study column, or set the “Open Config Window” input to Yes in Study Settings. A second modifier+click shortcut can be configured in Study Settings to clear all Big Print highlights with a single click.

The Config tab provides a preset system for saving and loading named configurations. Presets are stored per study type in their own file, separate from chartbook data. You can export presets to share with others and import them on any machine. If you run the study on multiple DOMs, each instance can load from the same preset file. All settings still save with the chartbook by default. The preset system is optional and provides a way to quickly recall and share specific configurations.

The config window supports dark and light themes. A theme dropdown and seven color controls let you match the window appearance to your chart setup.

Histogram

The histogram overlays bars on the edges of tail columns, displaying delta or Volume magnitude per Price Level. Bars draw on the winning side (Ask side for positive delta, Bid side for negative), indicating which side is dominant at each level.

Three Display Modes

  • Delta – Compares Bid and Ask Volume at the same price. The bar appears on the winning side, sized by the absolute delta.
  • Delta Diagonal – Compares Ask Volume at one price against Bid Volume one Tick Size below (the diagonal relationship). This mode displays the relationship between aggressive and passive flow across adjacent levels.
  • Volume – Draws both Bid and Ask bars simultaneously, sized by raw Volume. Both sides of activity are displayed at every price.

Threshold Color Intensity

Up to five user-defined thresholds control bar color intensity. As delta or volume grows, bars progress from the mildest color to the strongest. Values below the first threshold use a neutral color, keeping the display clean when activity is light. Each threshold level has its own configurable color for both positive (Ask winning) and negative (Bid winning) sides.

Variable Bar Width

Bars can scale proportionally by value so larger deltas or volumes produce wider bars. Two scaling modes are available: By All Rows uses the global maximum across all active rows as the 100% reference, and By Per Row scales each row independently so its largest value fills the full width. This allows the strongest levels to be identified visually without reading numbers.

Independent Duration

Histogram bars can persist independently of the tails themselves. Set a custom duration so bars remain visible after the tail fades, or set it to zero to tie bar lifetime to the tail. Histogram presets are available to quickly configure thresholds, colors, and layout.
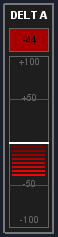
HUD Meter

The HUD Meter is a visual delta gauge, showing the cumulative delta of all active tails as it changes. Positive delta fills upward, negative fills downward, reflecting overall momentum direction and strength.

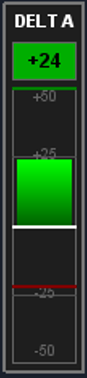
  • Multiple Presets – Choose from Default, Value Only, Basic Meter, Full Gauge, Compact, or Value Only with Title. Each preset configures size, layout, and visible elements for you.
  • Peak Indicators – Track min and max delta over a configurable time window. Peaks display as colored markers on the meter with optional numeric values, so you can see the extremes even as the current value moves.
  • Gradient and Segmented Fill – Choose between a smooth gradient fill or segmented bars for the meter visualization. Segment height and spacing are fully configurable.
  • Flexible Positioning – Place the meter in any corner or along the middle edges of the chart. X and Y pixel offsets allow precise positioning. Width, height, and value-only height are all adjustable.
  • Scale and Labels – Scale markers, position indicator, title, and value readout are all optional. Each element has its own font size and color settings. The scale can display inside the meter or on either side.
  • Full Color Control – Separate colors are provided for positive, negative, zero value, zero line, background, and border. The container box has its own background, border, and spacing settings.

Setup

Setup requires a few steps. The study reads volume data from Sierra Chart’s built-in Recent Bid/Ask Volume columns, so those need to be visible before the study will display tails.

  1. Enable Required Columns – Go to Trade > Customize Chart/Trade DOM Columns and move Recent Bid Volume and/or Recent Ask Volume from Hidden Columns to Visible Columns. At least one must be visible.
  2. Add the Study – Open Analysis > Studies on the Chart or DOM where you want tails, search for “gc: DOM Momentum Tails V2” and add it. (The original V1 study is also available in the same DLL.) Assign the Bid and Ask columns in the Study Settings.
  3. Set Combine Increment – Leave at 0 (Auto) to auto-detect from your DOM price scale, or set a manual value. Auto mode reads from your Scale Settings and keeps everything aligned.
  4. Check Chart Update Interval – Since tails are time-sensitive, a lower update interval captures more activity. Go to Chart Settings > General > Chart Update Interval. Sierra Chart warns that very low intervals (50ms or less) across many charts can increase CPU load and cause data lag. Adjust based on your system and number of open charts.

Note: You can install the study directly into a Recent Bid/Ask Volume column. The study will overlay tails on top of the existing volume data, saving you a column. The study includes a repaint option to cleanly overlay its own volume text on top of Sierra Chart’s native text.

Configuration: Right-click on the Chart or DOM Region and select Open Settings to open the config window. All settings are organized by tab. You can also set a modifier+click shortcut in Study Settings to open the window with a click on the study column.

Pricing

Momentum Tails - Free Access

Free

Select

No Credit Card Required, No Expiration.

Access is free. No credit card required, no expiration. Click “Get Access” above to sign up.

These studies are built and maintained by one developer. Hosting and infrastructure have real costs. If you find the studies useful and would like to support ongoing development, contributions are welcome here: [Contribute]

If not, please use them anyway, there is no obligation.

What columns do I need visible?

At least one of Recent Bid Volume or Recent Ask Volume must be visible in your DOM. Go to Trade > Customize Chart/Trade DOM Columns and ensure they are listed under Visible Columns.

Can I use this on a regular Chart instead of a DOM?

Yes. The study works on both as long as your Chart has Chart DOM enabled. Trade->Trading Chart DOM On

Why do I see ghost tails when I first add the study?

If the Recent Bid/Ask Volume columns already contain old data when the study is added, a few stale tails may appear initially. They will fade within the configured timeout period.

What does Combine Increment do?

It controls the price grouping for tails and histogram bars. Set to 0 (Auto) to match your DOM’s price scale automatically, or set a manual value. This ensures tails align with the DOM grid.

Can I use the histogram without showing tails?

The histogram and delta display work independently of the volume display mode. You can set Volume Display to None and still see histogram bars, delta text, and the HUD meter based on active tail data.

What are the subgraphs for?

The study outputs Delta (SG0), Min Delta (SG1), and Max Delta (SG2) as subgraphs. These can be used for spreadsheet output, alert conditions, or as inputs to other studies. Min and Max track peaks over a configurable time window.

Why does my chart update interval matter?

Momentum Tails is update-sensitive. If your Chart Update Interval is set too high, brief volume prints can be missed between refreshes resulting in gaps in tail coverage. A lower interval captures more activity and gives the most accurate tail representation. It is recommended to run your execution charts on a dedicated Sierra Chart instance set to the lowest Chart Update Interval your system can handle without impacting overall performance.

What data type should I use?

Tick-level data is recommended. The study relies on recent bid and ask volume which updates on each trade. Tick-by-tick data ensures every print is captured. Higher timeframe or aggregated data may miss brief volume events.

Will this impact my CPU or performance?

For the best experience use a modern multi-core processor, enable OpenGL in Sierra Chart (Global Settings > Graphics Settings – Global), and make sure your graphics card drivers are up to date. If you notice performance issues, try increasing the Combine Increment (fewer rows to process) or disabling features you don’t need (histogram, HUD meter).

Should I enable OpenGL?

Yes, OpenGL is recommended. Sierra Chart’s OpenGL rendering mode offloads drawing to your GPU, which significantly reduces CPU usage for studies with frequent visual updates like Momentum Tails. Enable it in Global Settings > Graphics Settings – Global > Other > Use OpenGL for Chart Graphics.

Can I run multiple instances of the study?

Yes, you can add the study to multiple charts or DOMs. Each instance runs independently with its own settings. Keep in mind that each instance adds processing overhead, so on slower systems you may want to limit the number of active instances or reduce features on less critical windows.

What happens when Recent Bid/Ask Volume is cleared?

The study reads from Sierra Chart’s Recent Bid/Ask Volume data. When that data is cleared, the histogram resets regardless of its own duration timer. This can happen through a manual clear shortcut, Sierra Chart’s built-in “Clear Recent Bid Ask Volume Inactive Time” timer, or a custom study that clears volume on a bar or time interval (such as the free gc: Clear Recent Bid/Ask Volume study available on this site). Tails are tracked independently and are not affected by volume clears.

What is Volume Calculation Mode?

The Volume tab has a Volume Calc dropdown with two modes. All Recent Volume (default) uses Sierra Chart’s raw recent bid/ask volume for all calculations. Tail Activity Only counts only volume that printed after the tail reached each price, ignoring volume that was already there. For example, if the ask column shows 37 at a price but only 5 printed during the current tail, Tail Activity mode uses 5 for threshold comparisons instead of 37. This reduces false Big Print highlights and histogram spikes caused by stale volume at tail edges. Volume numbers displayed on the DOM always show raw Sierra Chart volume regardless of this setting.

Why do my Big Print highlights clear when price barely touches a level?

The default Clear Condition is “Volume Below Threshold,” which clears highlights when volume at the price drops below the detection threshold. Sierra Chart’s “Reset Recent Bid/Ask Volume on Bid/Ask Change” setting (Global Settings > Chart DOM Settings > Other > Other Settings) defaults to Yes, which zeros volume on quote touches even without a trade. When volume drops to zero, it falls below the detection threshold and the highlight clears. Two options address this. Setting SC’s “Recent Bid Ask Volume Timeout in Milliseconds” to a nonzero value (e.g., 1500ms) prevents volume from resetting on brief price fluctuations, so highlights survive quote touches. Alternatively, switching the Clear Condition to “New Volume Printed” keeps highlights alive through SC volume resets and only clears when genuinely new volume prints at the level. NVP works best with a nonzero SC timeout.

Can I run two instances with different Volume Calculation Modes?

Yes. Each instance has its own settings. You can run one instance with All Recent Volume and another with Tail Activity Only on the same DOM to compare behavior. The filtered instance will generally trigger highlights later (since it ignores stale volume) and may show different delta values at the same price.

What Sierra Chart version is required?

The study is built for Sierra Chart version 2784 and above. Testing has been completed on version 2813 and higher. Newer versions may include API improvements that enhance performance and compatibility.

What is the difference between V1 and V2?

Both versions share the same core tail, delta, histogram, and HUD meter features. V2 adds a tabbed settings window, Big Print highlighting, a volume calculation mode, a preset system, theme support, and the ability to disable tails entirely. V1 remains available in the same DLL for anyone who prefers the native Study Settings input list.

How do Big Print modes work?

Big Print highlighting has three persistence modes. Decay Timer highlights the price level and fades it after a configurable timeout. Until Revisited keeps the highlight until a clearing condition fires: Volume Below Threshold (default) clears when volume drops below the detection threshold, or New Volume Printed clears when new volume at the level exceeds the detection snapshot. Both (recommended) uses the Decay Timer alongside Until Revisited, clearing on whichever condition is met first. Volume highlighting and delta imbalance highlighting each have their own mode and threshold settings.

Why is a Big Print highlight showing below my threshold?

The highlight was correct when it triggered. In fast markets, volume at a price can exceed your threshold and fire the highlight, then additional trades on the opposite side or a volume reset can change the displayed number before you notice it. The highlight reflects what happened at the moment of detection, not what the column shows afterward. If you see this frequently, the market is moving faster than the visual refresh. This is normal behavior, especially on active instruments like ES and NQ.

How do I clear Big Print highlights?

Highlights clear automatically when SC Recent Bid/Ask Volume is reset (keyboard shortcut, clearing study, or timeout expiry). This is the most common clearing path during normal use. Additionally, you can right-click on the Chart or DOM Region and select Clear Big Print Highlights to clear all volume and delta imbalance highlights at once, or configure a modifier+click shortcut in Study Settings for single-click clearing on the study column. Changing any Big Print setting in the config window also resets all highlights. In Both mode, highlights also clear when the Decay Timer expires.

What does the Clear Condition setting do?

The Clear Condition dropdown on the Big Print tab controls how the Until Revisited clearing path evaluates volume at a highlighted price. Volume Below Threshold (default) clears the highlight when volume at the price drops below the detection threshold. This works with all SC timeout configurations. New Volume Printed clears the highlight when filtered volume at the price exceeds the detection snapshot by the Min New Volume amount. NVP is designed for use with SC’s “Recent Bid Ask Volume Timeout” set to a nonzero value. With SC timeout at 0, volume resets on every price departure and NVP highlights may not clear because volume cannot rebuild past the detection snapshot. Use Volume Below Threshold when SC timeout is 0.

When should I use Volume Below Threshold vs New Volume Printed?

Volume Below Threshold (default) is recommended for most users. Highlights appear when a big print happens and clear when price departs the level and Sierra Chart resets the volume. This keeps the DOM clean and works with all SC timeout settings. With a nonzero SC timeout (e.g., 1500ms), highlights survive brief quote touches and clear when price genuinely moves away.

New Volume Printed is an advanced option for users who want highlights to survive SC volume resets and only clear when genuinely new volume trades at the level. It is designed for measuring absorption and requires careful tuning of the Min New Volume setting. NVP requires SC’s “Recent Bid Ask Volume Timeout in Milliseconds” set to a nonzero value to function correctly, but most users with a nonzero timeout will still prefer Volume Below Threshold for its simpler, self-correcting behavior.

What does Min New Volume do?

Min New Volume controls how many new lots must trade at a highlighted price before a New Volume Printed highlight clears. The default is 1, meaning any new volume clears the highlight. Higher values (e.g., 20 or 50) keep the highlight visible longer, requiring more trading activity before it clears. This setting only applies when the Clear Condition is set to New Volume Printed. It has no effect on Volume Below Threshold.

Where are presets stored?

Each study type stores presets in its own configuration file, separate from your chartbook. Settings always save with the chartbook by default. The preset file is an additional layer for quickly saving, loading, and sharing named configurations. Presets can be exported and imported between machines.

v2.0.5 Changelog

  • Histogram False Detection Fix – Histogram bars now detect asymmetric SC volume resets at tail extremities and suppress false bars from stale volume.

v2.0.4 Changelog

  • Big Print Clearing Fix – Highlights now clear correctly in all modes. Volume Below Threshold is the default Clear Condition and recommended for most users. New Volume Printed is available as an advanced option for absorption measurement. Highlights auto-clear when SC Recent Bid/Ask Volume is reset. Manual clear available from right-click menu or modifier+click shortcut.
  • Delta Imbalance False Detection Fix – Delta imbalance detection now verifies genuine new trading on the dominant side before highlighting. Stale volume from SC resets no longer triggers false delta highlights.
  • Delta Imbalance Bid/Ask Colors – Separate colors for Bid-dominant (red default) and Ask-dominant (green default) sides, configurable on the Big Print tab.
  • Volume Calc Mode Fix – Tail Activity Only mode now uses filtered volume consistently for both detection and clearing.

v2.0.2 / v2.0.3 Changelog:

  • Big Print Improvements – Highlights now clear correctly in all modes. New Volume Printed clears when new volume prints at the level (configurable via Min New Volume setting). Volume Below Threshold is now the default Clear Condition. Highlights auto-clear when SC Recent Bid/Ask Volume is reset. Manual clear available from right-click menu or modifier+click shortcut.
  • Delta Imbalance Bid/Ask Colors – Separate colors for Bid-dominant (red default) and Ask-dominant (green default) sides, configurable on the Big Print tab.
  • Volume Calc Mode Fix – Tail Activity Only mode now uses filtered volume consistently for both detection and clearing.

v2.0.1 Changelog:

  • Volume Calculation Mode – New dropdown on the Volume tab. Tail Activity Only mode filters stale volume from Big Print, delta imbalance, and histogram calculations, counting only volume that printed after the tail reached each price
  • LTV Priority – New checkbox on the Volume tab. When enabled, the last traded volume highlight takes visual priority over Big Print highlighting at the same price

v2.0.0 Changelog:

  • Settings Window – Tabbed config window replaces native Study Settings input list. Tabs: Tails, Volume, Delta, Big Print, Meter, Histogram, DOM, Config, About
  • Big Print Highlighting – Threshold-based volume and delta imbalance highlighting with three persistence modes (Decay Timer, Until Revisited, Both)
  • Preset System – Save, load, export, and import named configuration presets per study type
  • Theme Support – Dark and light themes with full color customization for the config window
  • Disable Tails – Tails can be fully disabled to use other features independently
  • All V1 features carried forward with the same core behavior

v1.1.0.0 Changelog:

  • Last Traded Highlight modes – Outline/Fill dropdown replaces Yes/No toggle. Fill option fills the cell background (like SC native), Outline draws a border (previous behavior)
  • Display Both Last Traded Highlights – New toggle to show both bid and ask last traded highlights simultaneously (Yes, default) or only the most recently traded side (No)
  • Repaint dropdown consolidated – “Independent Bid/Ask Background” folded into the Repaint dropdown
  • Fixed input overflow – Inputs exceeded SC’s 128 limit and last input was hidden

v1.0.0.0 Changelog:

  • Initial Study Release

More questions? Contact support

Thanks to the beta testers whose feedback and suggestions helped shape many of the features in this study.

Get Started with Momentum Tails

No Credit Card Required, No Expiration